KEY PERFORMANCE INDICATORS

Delivering a stable performance

We delivered another resilient performance and growth in a period of uncertainty.

Revenue from operations (` in million)

Net operating income (` in million)

EBITDA(` in million)

Cash flow from operations(` in million)

Net debt to market capitalisation (1)
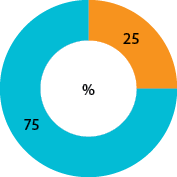
`102,102

Net debt

`308,492

Equity

Lowered cost of debt by 336 bps on
`32.8 billion refinancing (%)

Pre-refinancing interest cost

Post-refinancing interest cost

Net asset value

Particulars (` million) March 31, 2021 Gross Asset Value (GAV)(2,3) 466,051 Add: Other Assets 81,820 Less: Other Liabilities (74,298) Less: Gross Debt (106,223) Net Asset Value (NAV) 367,350 Number of Units 947,893,743 NAV per Unit (`) 387.54

Leverage metrics

Particulars March 31, 2021 Net debt to GAV 22% Net debt to EBITDA (4) 4.2x Interest coverage ratio   – excluding capitalised interest 3.3 x – including capitalised interest 3.0 x Available debt headroom `126 Billion

Proactive capital management

`15,502 million

Cash and undrawn committed facilities(1)

`41,000 million

Listed NCD issuances in FY2021

6.6%

Interest cost for listed NCDs issued in FY2021

AAA/Stable

Rating of listed NCDs by CRISIL

`38,125 million

Debt maturity in the next 2 years

`126 billion

Available debt headroom

Notes: All figures reflect the recent Series III NCD of `26,000 million raised on January 15, 2021

(1) Includes treasury balances, fixed deposits etc., net of 4Q FY2021 distribution of ` 5,308 million

Principal maturity schedule(` in million)

Notes:

  1. Closing price on National Stock Exchange as at March 31, 2021
  2. Gross Asset Value (GAV) considered per March 2021 valuation undertaken by iVAS Partners, represented by Mr. Manish Gupta, in conjunction with value assessment services undertaken by CBRE. Valuation exercise undertaken semi annually.
  3. Given Embassy REIT owns 50% economic interest in GLSP, GAV includes fair value of equity investment in GLSP basis equity valuation method
  4. ETV was acquired by Embassy REIT on December 24, 2020. The relevant asset SPVs and Holdco holding ETV have been consolidated from December 31, 2020, a date close to the acquisition date. Hence, Net Debt to EBITDA ratio has been computed and presented by including annualised figures for ETV based on 4Q FY2021